Writing · Case studies
How I doubled organic traffic and took leads from 32 to 74
Australian organic traffic went from 184 sessions to 376 after a conversion rebuild. Leads went 32 to 74, and the unfiltered total moved one per cent.
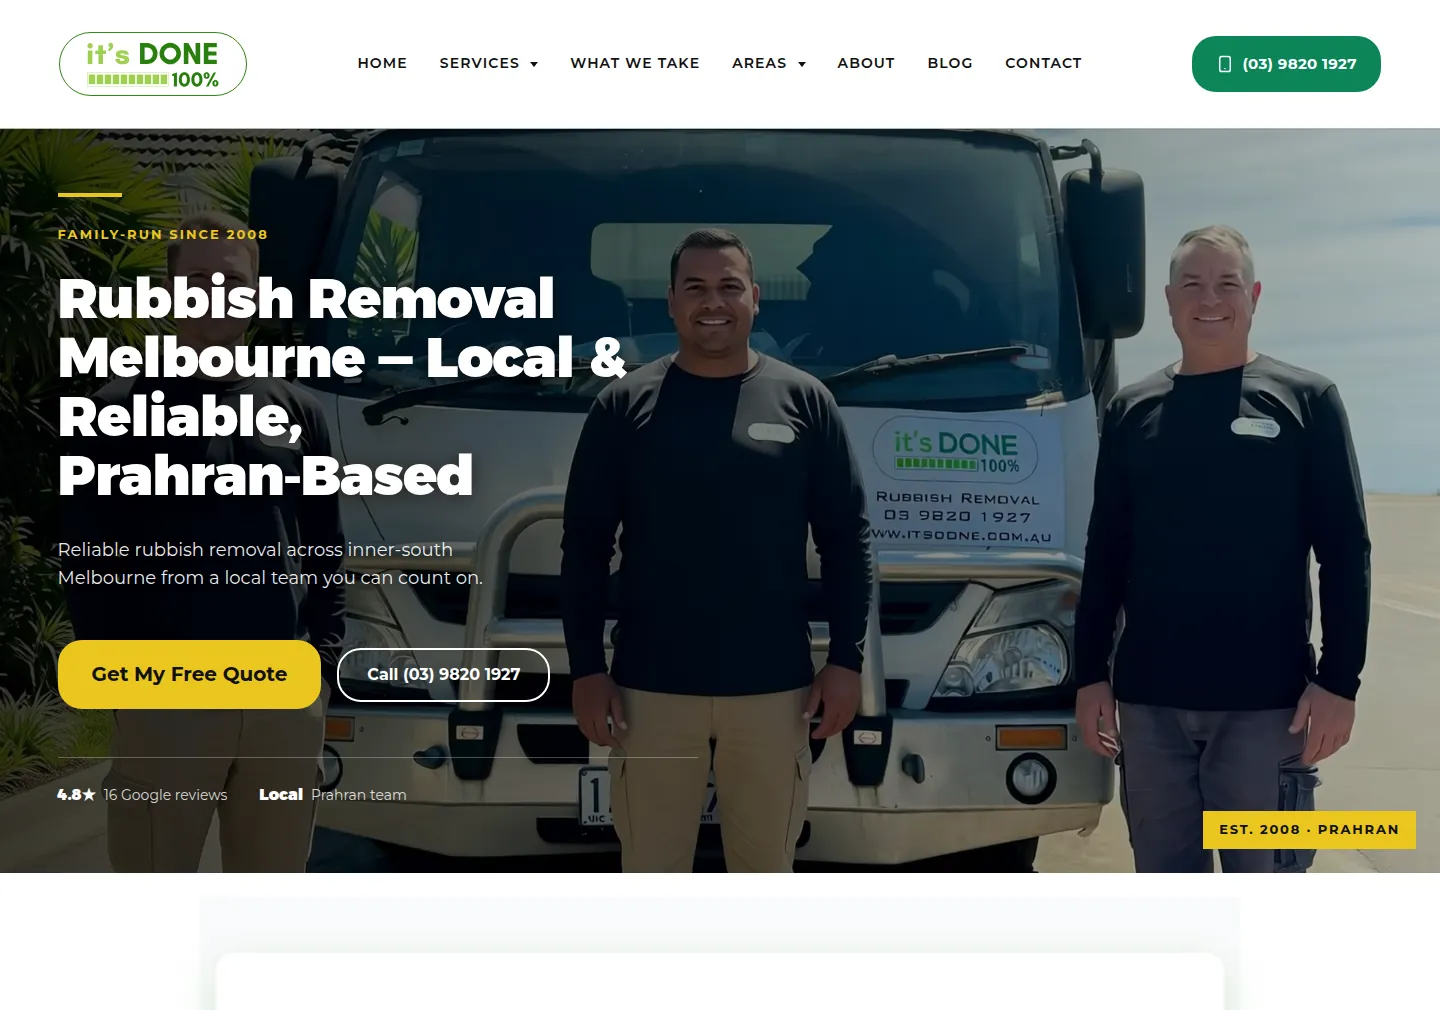
In June 2026 I rebuilt itsdone.com.au for conversion. It is the same site I had recovered after Google flagged it for social engineering content, two and a half years earlier, which is its own story.
In the two months after it went live, Australian organic sessions went from 184 to 376 and leads went from 32 to 74. The site went from ranking on page one for 654 searches to 997.
The rebuild in question. One offer, the phone number and the quote button above the fold, and the trust signals a local services buyer actually checks.
What the rebuild changed
By 2026 the site had come through a hack, a disinfection and a long recovery, and it ranked. That gave the second rebuild a narrower brief than the first one had: turn the visibility into phone calls.
A hero that answers “who am I calling”
Rob is an owner-operator with a small crew and a branded truck. A stranger deciding whether to let someone into their driveway wants to know that before anything else, so the homepage leads with him, his crew and the truck, above a single offer, the phone number and a quote button. It runs as a short muted video, so the first thing a visitor sees is a real crew and a real truck moving.
Item pages for the searches people actually type
Nobody searches for
“waste solutions”. They search for “mattress removal Melbourne”. So I built
dedicated pages under /what-we-take/ for the item types that carry that
intent: mattresses and beds, whitegoods and appliances, furniture, e-waste, and
paper and cardboard. Each one gets the room to answer what an item
search asks, in that order: whether you take it, how the job works, and what
it costs. They also complete a structure the service pages were already
built for, because their “what we take” cards point straight at these URLs.
Navigation that surfaces the money pages
A Residential and a Commercial megamenu panel put every service page one hover from anywhere on the site, which helps a visitor going straight for what they need and pushes internal links at the pages earning the rankings. Built without a plugin and without touching the parent theme.
Short videos on every service page
Each service page carries a brief clip of that work being done, on the page where someone is deciding whether to call. Thirty seconds of footage shows what the job looks like more directly than a paragraph describing it.
A quote form on the page
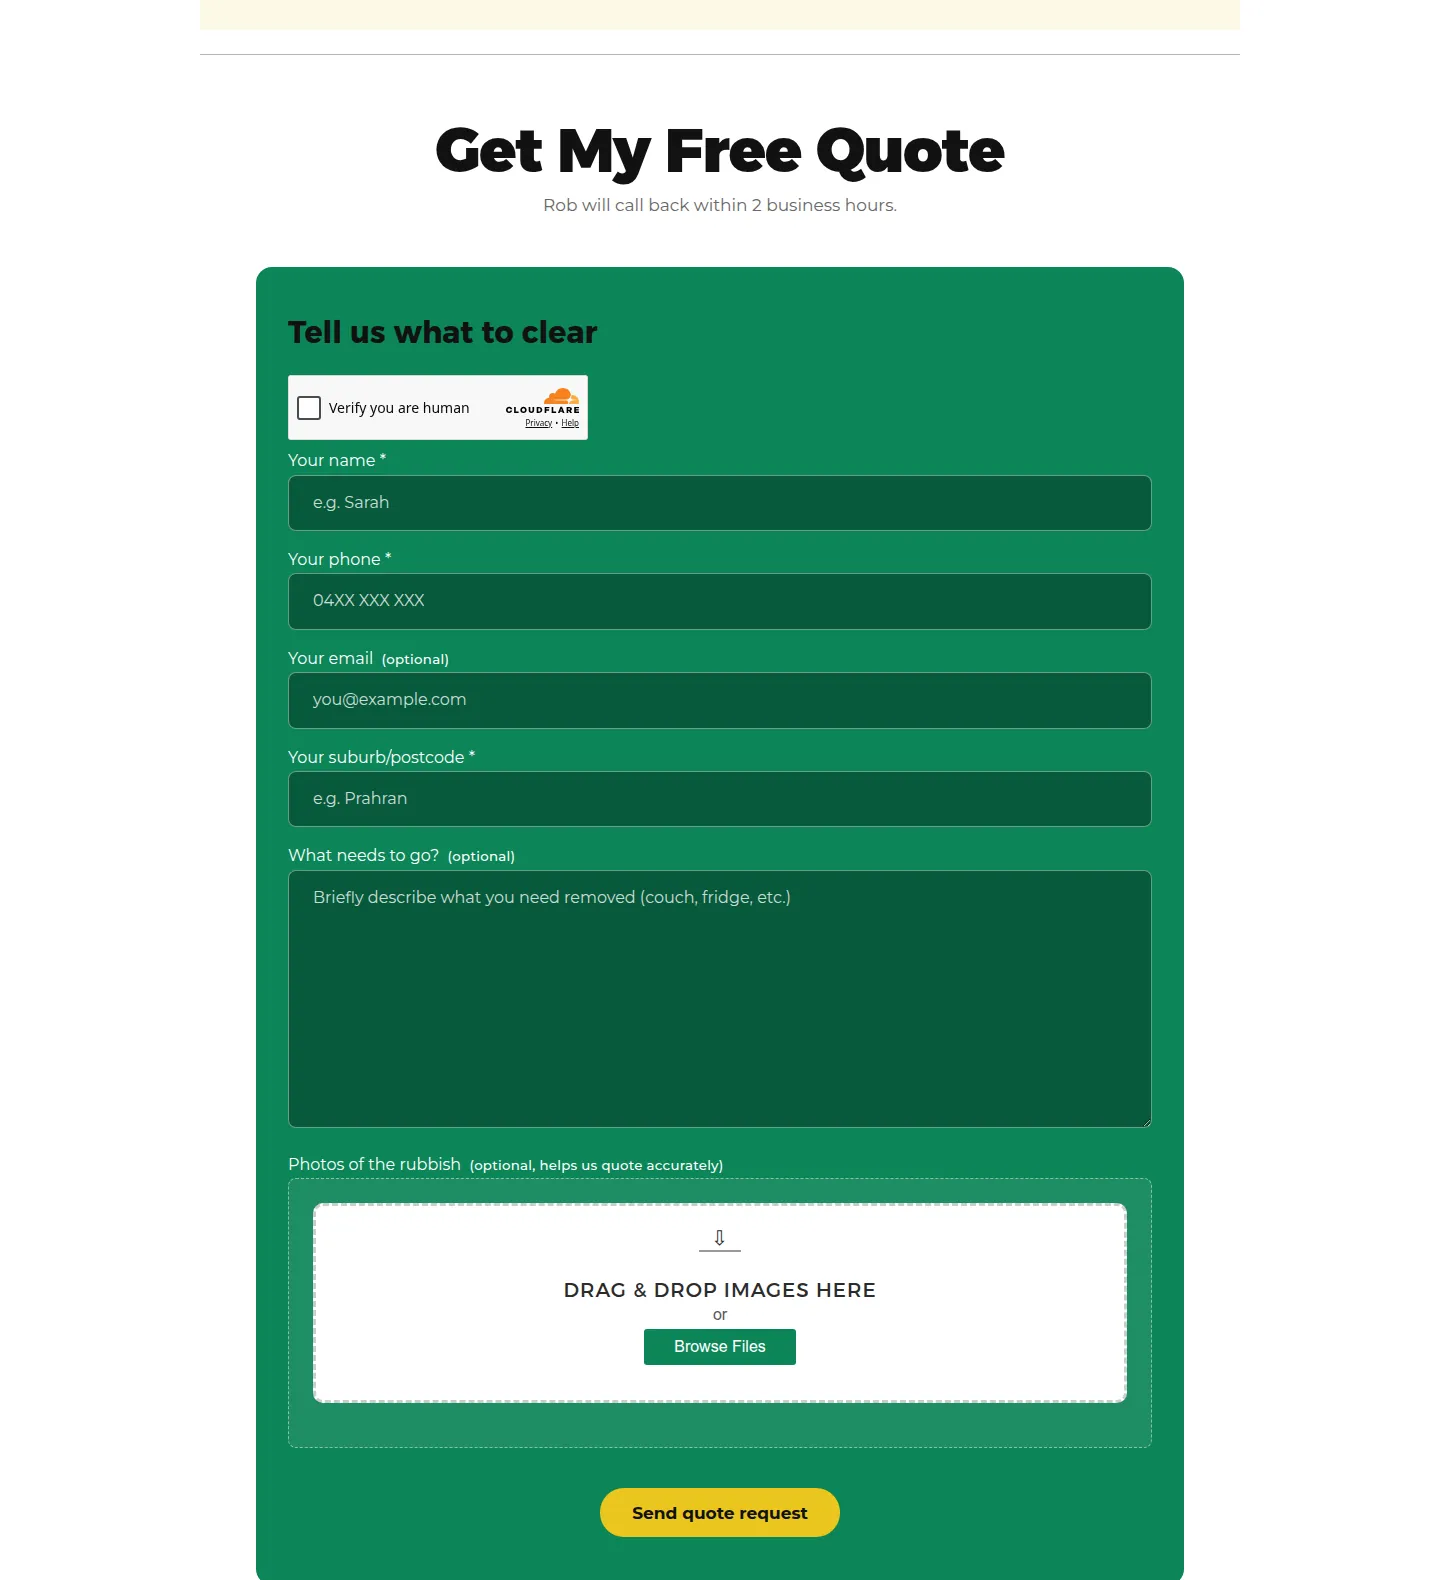
Every service and item page now ends with the whole form, sitting inline where someone who has just finished reading about their exact problem can act on it without a click in between. Phone is required and email is optional, because this is a business people ring. The photo upload lets Rob quote accurately without driving out to look at a pile of furniture, which takes the slowest step out of the sale.
This one can be isolated, because the contact page kept its own separate form throughout. Across the same two windows, callback requests through the service page forms went from 8 to 23, while submissions on the contact page went from 10 to 10. Both forms sat in front of the same traffic.
A fixed call and quote bar on mobile
Most of this traffic is someone standing in a garage looking at a pile of furniture, on a phone, with a hand free. A sticky bar with a call button and a quote button means the action is never more than one thumb away, wherever they have scrolled to. Phone link clicks went from 14 to 41 over the same windows, which is faster than the traffic underneath them grew.
Built as a theme, not a page builder
The site runs on a custom child theme with no ACF, no page-builder plugin and no framework licence. The entire plugin list on the front end is a contact form, a honeypot and Tag Manager. The trade is deliberate: every template, every piece of schema and every byte on the page is something I can edit directly, with no plugin abstraction in the way.
Reviews, collected on purpose
Rob had years of happy customers and no habit of asking any of them to say so. I talked him into asking routinely, as part of finishing a job, and those reviews now run through the service and item pages where a first-time buyer is deciding whether to trust him.
Pick the window before you pick the number
The rebuild went live on 28 June 2026. So a June-versus-July comparison straddles the launch, and a calendar month is the wrong unit for measuring something that happened mid-month.
I compare the two windows either side of the launch date instead: 1 May to 27 June against 28 June to 25 August. Fifty-eight days before, fifty-nine after. The extra day is stated rather than trimmed; it cannot account for a doubling.
Every GA4 and Search Console figure below is filtered to Australian users. This business quotes jobs in metropolitan Melbourne and cannot serve anyone else, so that is the population worth counting. It changes the numbers more than it sounds like it should, for reasons I come back to below.
What happened to traffic and leads
| Channel | Before | After | Change |
|---|---|---|---|
| Organic Search | 184 | 376 | +104% |
| AI Assistant | 1 | 36 | from nothing |
| Referral | 1 | 17 | from nothing |
| Direct | 21 | 189 | see below |
Direct is in the table for completeness and has a section of its own further down. I checked it and do not count it as real growth.
Leads went from 32 to 74 across the site, counted by the reporting pipeline I built for it. That is 41 phone link clicks, 23 callback requests and 10 contact page submissions, against 14, 8 and 10 in the window before, so the whole figure reconciles to three named events.
Search Console agrees independently, on the same windows and the same filter: organic clicks 153 to 300, up 96%. It counts differently and lands eight points below GA4’s +104%. I quote the Search Console number because it is the conservative one.
What happened to rankings
Clicks and sessions are outcomes. Underneath them is how many searches the site shows up on the first page for.
| Before | After | Change | |
|---|---|---|---|
| Queries ranking on page one | 654 | 997 | +52% |
| Queries ranking in the top three | 167 | 284 | +70% |
| Queries with any impression at all | 3,546 | 4,909 | +38% |
“First page” here means average position 10 or better across the window, over every query Search Console will show me. The definition matters, because the number changes a lot depending on where you put the floor, which is why it is stated here.
One more, and it is the one I would lead with. August 2026 was the strongest organic month in all 43 months the property has ever recorded: 277 Australian organic sessions, against a previous best of 210 in May 2025. August 2026 is a complete month, and so is the May 2025 month it beats.
Where it stands eleven weeks on
Everything above measures the rebuild: two windows either side of 28 June, fixed before the numbers were pulled. This section answers a different question, which is where the site sits now. These are current figures, not a second before-and-after, so do not read them as a continuation of the series above.
Average position, first-party, on windows already in use here
Search Console reports an average position across every query it will show me. On the 28 days before the rebuild that was 30.2.
| 28-day window | Average position |
|---|---|
| 31 May to 27 June, before the rebuild | 30.2 |
| 28 June to 25 July | 27.7 |
| 26 July to 22 August | 27.0 |
| 16 August to 12 September, latest complete | 22.4 |
The last row is the most recent complete 28 days, so it overlaps the row above it by a week. The first three do not overlap each other. Read the whole column for direction rather than size: average position moves with the mix of searches you appear for as well as with rankings. A site that starts showing up for a batch of new, rarely-searched phrases can shift its own average without a single existing ranking having moved.
Australian organic clicks by complete calendar month, over the same stretch: 72 in June, 142 in July, 210 in August. August is a complete month here. September is still running, so it is left out.
What a Melbourne searcher sees
Average position is a national average, and this business only quotes jobs in metropolitan Melbourne. So I also read positions straight off the live results page with the location pinned to Melbourne, using a Google rank tracker I built and run against my own clients. On 15 September, across 54 tracked job and suburb terms:
- 45 on page one
- 17 in the top three
- 9 suburbs in first place
The two sources are worth reading side by side, because they do not agree everywhere:
| Term | Melbourne, 15 Sep | Search Console average, Australia, 1 to 12 Sep |
|---|---|---|
| rubbish removal elwood | 1 | 2.0 |
| rubbish removal richmond | 2 | 3.7 |
| shed cleanout | 2 | 4.2 |
| deceased estate rubbish removal | 3 | 12.9 |
| garage cleanout | 6 | 11.6 |
| deceased estate clearance | 7 | 33.3 |
| rubbish removal melbourne | 9 | 12.3 |
On suburb terms the two agree closely, which is what you expect when almost everyone searching “rubbish removal elwood” is standing in Elwood. The gap widens as the term gets less local, and it is widest on “deceased estate clearance”: 7th in Melbourne against a national Search Console average of 33.3. The two are measuring different populations. Search Console is counting impressions from Sydney, Brisbane and Perth, where the site does not rank and should not, and those impressions pull the average down.
“Rubbish removal melbourne” is the term this business competes for, and it is on page one. It has earned almost no clicks there yet. Above it on that page sit a three-result map pack, the City of Melbourne’s hard waste page, Airtasker and six competing removal companies.
Three things these figures do not show.
No before-and-after on the tracked positions
On 13 September Google stopped pairing its redirect tokens with destination URLs, so I rebuilt the parser to read the visible citation line instead. It now returns roughly 1.4 fewer results per query than the sweep before it. Fewer competitors parsed above the brand produces a better rank number with nothing having moved, which means a raw comparison across that change reads as a broad improvement that did not happen. Current positions are unaffected, because they are read off the page that is there today, so I publish those and leave the deltas out.
Nine of the 54 are off page one
Nine more sit lower than they did on 6 September, one of them out of the top 30 altogether. Those declines are subject to the same parser caveat in the opposite direction, so I am not sizing them either.
The fifth window is not in the series yet
The 28-day windows in this article are anchored to the rebuild date, and the next one closes on 19 September. At 12 September it stood at 206 clicks across 21 of its 28 days, already past the 151 of the complete window before it. It goes into the table above once it is finished. A trailing 28 days ending at whatever day the data reaches would mean picking the window after seeing the number, which is what “Pick the window before you pick the number” above is about.
The channel that did not exist before
The AI Assistant row is easy to skip past. It went from 1 session to 36, and those 36 produced 14 lead actions. Set against the other channels over the same window:
| Channel | Sessions | Lead actions | Per session |
|---|---|---|---|
| Organic Search | 376 | 40 | 10.6% |
| Direct | 189 | 17 | 9.0% |
| AI Assistant | 36 | 14 | 38.9% |
Lead actions per session, the same basis as every other rate in this article. It converts better than any other channel on the site, on the smallest volume.
It also did not exist here before the rebuild. January to May 2026: no AI assistant sessions at all. June: one session and no leads. July: 13 sessions and 5 lead actions. August: 25 sessions and 11 lead actions, across a complete month.
Two things I would not take from that. The rebuild is not what created the traffic, because AI referrals grew across the web through 2026 and a single site cannot separate its own effect from the trend. And the sample is small enough to move a long way: 36 sessions, 31 of them from ChatGPT, and all 14 lead actions came from ChatGPT. Perplexity and Gemini sent five sessions between them and no leads.
What the rebuild does explain is what happened once that traffic arrived. People coming from an AI assistant already know what they want.
“Is that just the season?”
Rubbish removal has a season, so it is a fair question. The property holds four years of data, so the test is the same window pair in every one of them. Australian organic sessions, every year:
| Year | May + June | July + August | Change |
|---|---|---|---|
| 2023 | 117 | 130 | +11% |
| 2024 | 182 | 220 | +21% |
| 2025 | 390 | 284 | -27% |
| 2026 | 194 | 430 | +122% |
2023 is the hack year and would flatter the average, so I throw it out.
That leaves one clean year up 21% and another down 27%. There is no reliable seasonal uplift between these windows. Averaged, the season runs slightly against the comparison, at an index of 0.97. Applying it, July and August 2026 should have come in around 188 sessions. They came in at 430, and August 2026 is a complete month here, measured against complete months in every other year of the table.
The business varies by season, and not by anything close to this much.
The rest of the SEO programme
The rebuild is one part of a longer programme, and the parts were built to feed each other. The numbers above are the result of all of it, so this is what the rest of it consists of.
Fifty-five suburb pages, each written for its own suburb
They run around 1,300 words. Compare any two and roughly 30% of the words differ, and it is the 30% that matters locally: the named streets a truck has to park on, the housing stock, and the correct council with that council’s own hard waste rules, so Elwood carries City of Port Phillip’s two cubic metre limit and Carlton carries City of Melbourne’s annual allocation. The shared part is the service description. Where that line sits, and why it is not a doorway page, is its own article: building location pages at scale without making doorway pages.
Video on 113 URLs
Fifty-five
suburb pages, 43 articles and the rest across service and item pages. Every one
carries VideoObject markup. The sitemap that lists them is generated by the
theme; it replaced the paid plugin tier that had been supplying it, and matches
its output field for field.
Articles written to feed the service pages
New articles and substantial rewrites, each with a short explainer video, each pushed automatically to Google Business Profile, Pinterest and LinkedIn by pipelines I built rather than licensed. Blog URLs earning Australian impressions went from 22 before the rebuild to 75 after. The link from an article back to the page that sells the work is a built structure: a plugin adds links as each page is built, running from article prose into the service and item pages, capped at five per article, with hand-placed article-to-article links on top. A crawl in July counted 259 of the automatic ones.
Google Business Profile
A plugin I built has posted new articles to the profile since mid-July. The profile’s service list was rewritten through the API to 20 services that mirror the site’s service pages one to one, down from 40 that had drifted into offering things the business does not do.
Pinterest and LinkedIn
Pinterest runs three times a day across five
boards, routed by article category. LinkedIn posts on weekdays, filtered to the
two categories a commercial reader would care about. Links from both carry a nofollow tag, which tells Google to pass no
ranking credit through them. So this is people finding the business, and none of
it helps the site rank.
A named person behind the articles
The owner has an author archive carrying Person and ProfilePage markup, so
the articles carry a named human who does the work himself. Google’s quality
guidelines lean on experience, expertise, authority and trust, which the
industry shortens to E-E-A-T, and a named practitioner who actually does the job
is the cheapest honest way to show all four. The reviews under them are real and collected routinely as
part of finishing a job.
Schema, page type by page type
A suburb page emits Service, FAQPage, VideoObject, BreadcrumbList,
Place with City and GeoCoordinates, ImageObject, WebPage and
WebSite. A service page adds ItemList. The author page emits Person,
ProfilePage and LocalBusiness. All of that is on the live pages today and
can be checked from a browser.
Page speed, measured warm
PageSpeed Insights mobile went 82 to 90, total blocking time 170ms to 100ms, page weight down 769 KiB across 18 fewer requests, and the stylesheets that have to load before anything appears went from nine to three. Accessibility, best practices and SEO sit at 100.
Two limits on that. These are lab numbers from a simulated page load, and the site does not appear in the report Google builds from real Chrome visits, because it has not had enough traffic to reach the threshold for being included. So none of it says what actual visitors experienced, and none of it is a statement about Core Web Vitals, the speed measures Google scores pages on.
What all of that does to attribution
It is one programme with a lot of parts, and I cannot tell you how much of the growth each part produced. They were built to work together, and supporting content feeding the pages that sell is what the programme was for.
The conversion side is separable. Callback requests through the service page forms went from 8 to 23 while the contact page sat at 10, and both forms were in front of all of that traffic, new readers included. More readers does not explain why one of the two forms started converting and the other did not.
What the conversion rate did
Organic leads went from 29 to 40. The blended organic conversion rate fell over the same period, from 15.8% to 10.6%, and that is a change in the mix of traffic rather than a change in how the pages convert.
Blog pages were the landing page for 118 of the 376 organic sessions after the rebuild, against 21 of 184 before. Someone reading about their council’s hard rubbish dates is answering a question, not booking a truck. Take the article landings out of both windows and the pages built to sell hold their rate: 17.8% before, 15.5% after. A content programme adds traffic at the top of the funnel faster than it adds intent, and a blended rate reflects that.
Worth knowing for anyone measuring this: GA4 credits article landings with a single lead action across the whole period, from the piece on Melbourne tip fees. Session-scoped attribution only sees somebody who reads and acts in the same visit, so a reader who finds an article in July and rings in September arrives as a new session on a different page. The articles are contributing leads that this report cannot size.
Why the traffic looked flat
Everything above is filtered to Australian users. Unfiltered, total sessions across the same two windows went from 1,006 to 1,021. That is one per cent. Report it and you conclude the rebuild did nothing for traffic.
| Before | After | Change | |
|---|---|---|---|
| Australian sessions | 209 | 627 | +200% |
| Non-Australian sessions | 797 | 394 | -51% |
| Total, unfiltered | 1,006 | 1,021 | +1% |
Read the Australian row for its direction rather than its size, because part of it is a Direct channel I do not trust, which is the next section.
The non-Australian half did not fall by accident. I put Cloudflare and country IP blocking in front of the site in the first week of July, deliberately, and for a business that only quotes in Melbourne that traffic was never going to become work. So two deliberate changes cancelled each other out in the total: one grew the Australian audience, the other removed visits from countries the business cannot serve. The unfiltered total is accurate and tells you nothing about the rebuild.
Two notes, because both are fair objections. The country filter is a reporting choice applied when the report runs, not a collection rule, so it reaches back across the property’s whole history and the four-year table above is filtered identically in every year of it. And the filter guts GA4 while barely touching Search Console, whose organic clicks go 156 to 153 before and 300 to 300 after, which tells you the traffic it removed was not arriving through search.
Checking the channel that grew fastest
Australian Direct sessions went from 21 to 189, the largest movement anywhere in this data, so it got the same breakdown the countries did.
Sixty-one of those 189 sessions landed on the homepage on desktop and produced one lead between them. In August alone that row is 44 sessions and none. A few more arrive with no landing page recorded at all. This is a business people find on a phone and ring, so desktop traffic that types in the address and never calls is most likely Rob and me, checking the new pages on the desktops we built them on.
So it is left out of everything above. Strip Direct from both sides and Australian sessions still go from 188 to 438.
Get in touch
Tell me about the role and I will come back to you. If you would rather not use a form, I am on LinkedIn.