Writing · Tooling
How I built a client dashboard that rebuilds itself hourly
Client reporting built on GA4 and Google Business Profile that refuses to count a desktop tel: click as a phone call, and republishes itself every hour.
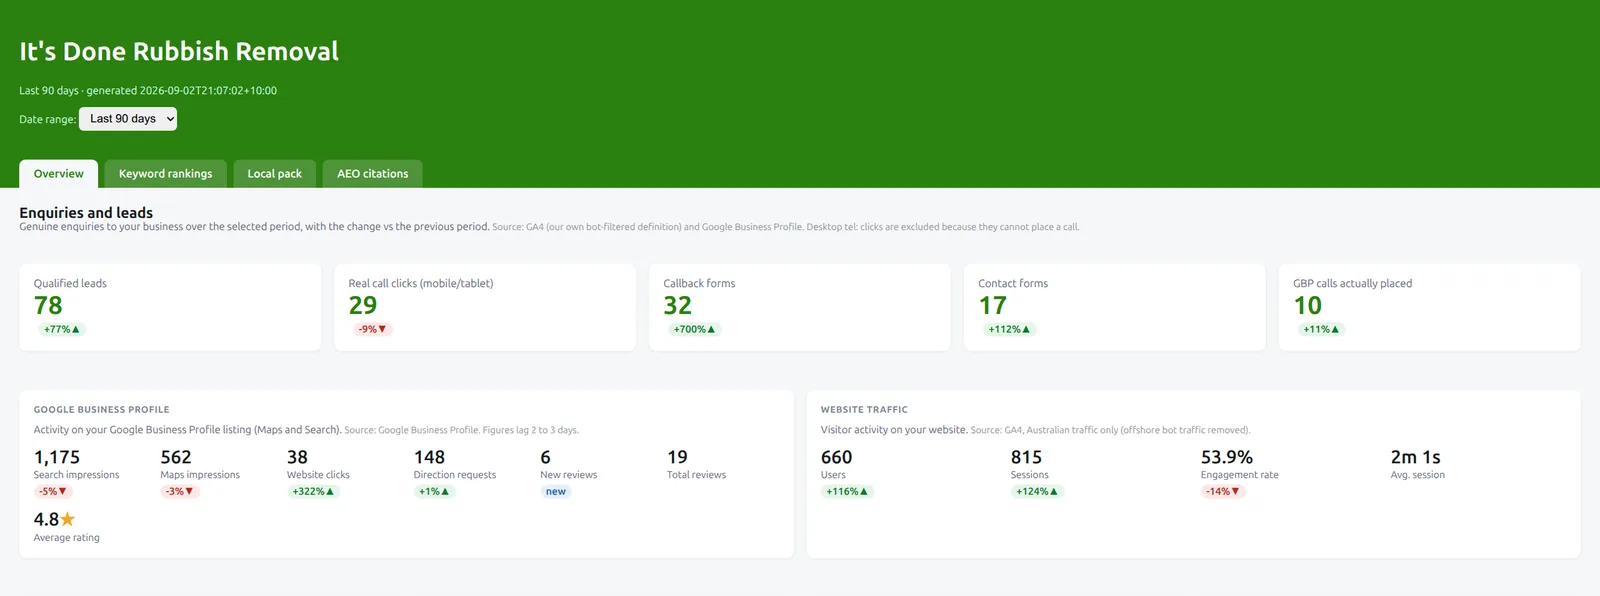
Every lead number I quote for It’s Done Rubbish Removal (itsdone.com.au, whose rebuild has its own story) comes out of a pipeline I wrote rather than a screenshot I took. It pulls GA4 and Google Business Profile data, classifies what counts as a lead, renders an interactive HTML dashboard, and rsyncs it to a reports subdomain behind HTTP basic auth. A crontab entry runs the whole cycle at seven minutes past every hour.
A desktop tel: click is not a phone call
The obvious way to measure phone leads in GA4 is to count clicks on the tel:
link. That number overcounts.
Most desktop browsers cannot dial a tel: link. Someone clicks it, a dialog
appears asking which application should handle the link, and nothing happens.
The click still fires the event. Count it and your phone lead figure includes
people who never made a call and could not have.
So the classifier sorts the events:
- real_call_clicks:
phone_link_clickon mobile or tablet only. - filtered_desktop_clicks: the same event on desktop, counted separately and shown in a data quality panel rather than folded into the total.
- callback_forms and contact_forms: form submissions, which count on any device, because a form works the same everywhere.
The headline KPI, qualified_total, adds real_call_clicks, callback_forms
and contact_forms. filtered_desktop_clicks is the one it leaves out. One
function, classify_leads() in filters.py, decides what a lead is, and
nothing else in the codebase gets a say. The device breakdown on the dashboard
reads that same function, so the chart and the number above it cannot
disagree.
Reporting a smaller number than the raw event count is uncomfortable the first time. It is easier than being asked, six months later, how many of those calls connected.
Google Business Profile calls sit beside the total, never inside it
The dashboard also pulls call interactions from Google Business Profile. Those are real calls, and for a local trade business they matter as much as anything on the site.
I still leave them out of qualified_total, because I cannot deduplicate them.
Someone who finds the business in the map pack, taps the call button, and also
lands on the site is one person. GA4 sees the site visit, Google Business
Profile sees the call, and there is no shared identifier to join them on. Add
the two figures and you get a number somewhere between correct and double, with
no way to tell where.
So the dashboard shows them side by side, and qualified_total counts only
what GA4 can see.
The cron refuses to publish from a dirty working tree
This guard has nothing to do with analytics.
The script that crontab entry runs publishes to a client-facing URL straight from the working tree. It does not check out a ref of its own. That means the state of my local checkout at seven minutes past the hour is what the client sees, and I develop in that same checkout.
Unchecked, an hour on a feature branch would ship unreviewed work to a live client report on a schedule. So it tests two things before doing anything:
- The branch is
main. A detached HEAD reports asHEAD, which is notmain, so the same check catches it. git status --porcelainis empty. Untracked files count, because an untracked client YAML gets picked up by--alland would publish a client nobody reviewed.
If either check fails, the run stops, publishes nothing, and sends a Telegram message saying which branch it found. There is an override for a deliberate manual publish off a dirty tree, and you have to set it yourself.
A skipped hour costs nothing, and that message tells me it happened. A bad publish is in front of the client before anyone notices.
Pointing it at another client is not a config change
Each client is a YAML file, and --all iterates over the directory, so adding
one is a file rather than a fork. Only one is configured today. The credentials
behind it are still manual: a GA4 property ID, a Google Business Profile
account and location, an OAuth token with the business.manage scope, and an
SSH key that can reach the publish target.
The lead definitions also match how I tagged this site. The three event names
in filters.py are the events I put there. Pointing this at a site somebody
else tagged means reading their tagging and editing that file.
It runs hourly against real client data, and it produces the It’s Done figures quoted on this site.
Get in touch
Tell me about the role and I will come back to you. If you would rather not use a form, I am on LinkedIn.